Fig. 12
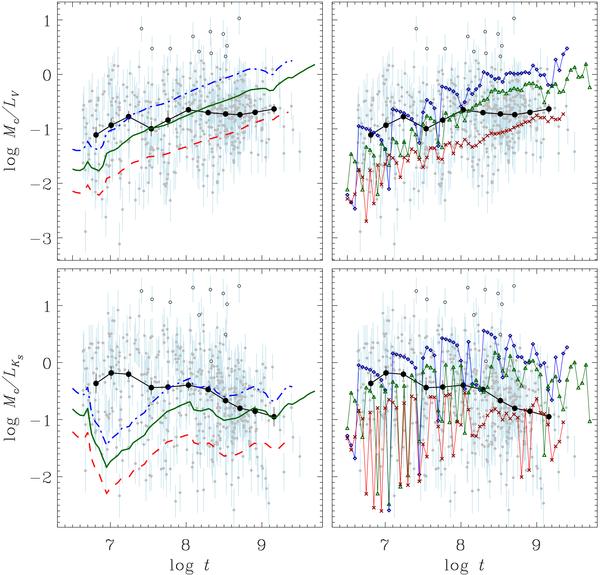
Comparison of observed and theoretical Mc/L,log t-relations for continuous-IMF (left panels) and discrete-IMF models (right panels), cluster mass of Mc = 103 m⊙, and variable lower limit of stellar mass ml. The upper row corresponds to the optical, the lower one to the NIR passbands. The designations for the empirical data are the same as in Fig. 10. For the models dash-dotted blue lines (diamonds in the right panels) correspond to ml = 0.01 m⊙, solid green lines (triangles) to ml = 0.1 m⊙, and dashed red line (crosses) to ml = 1 m⊙.
Current usage metrics show cumulative count of Article Views (full-text article views including HTML views, PDF and ePub downloads, according to the available data) and Abstracts Views on Vision4Press platform.
Data correspond to usage on the plateform after 2015. The current usage metrics is available 48-96 hours after online publication and is updated daily on week days.
Initial download of the metrics may take a while.