Fig. 11
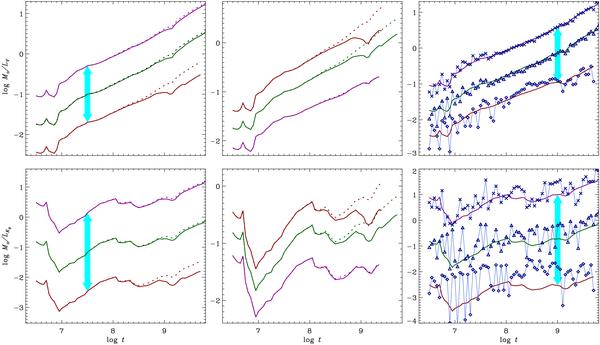
Evolution of the mass-to-luminosity ratio in the optical (upper row) and NIR (lower row) and various population effects. The curves shown in the left and middle panels present SSP models with continuous IMF, in the right panels we compare continuous-IMF and discrete-IMF cases. The left panels show the influence of cluster mass loss owing to dynamical evolution for clusters of different initial masses with stellar low-mass limit ml = 0.1 m⊙. The curves are artificially shifted vertically in order to avoid crowding as shown by cyan arrows. The upper (shifted up) curve corresponds to the initial mass of Mc = 104 m⊙, the middle (shown in the original position) curve is for Mc = 5 × 10³ m⊙, and the lower (shifted down) curve corresponds to Mc = 103 m⊙. The dotted portions (as everywhere in this figure) mark models without mass loss. The middle panels show the effect of variations of the lower mass limit of stars for a model of Mc = 103 m⊙. The upper, middle, and bottom curves correspond to ml = 0.01, 0.1, 1 m⊙, respectively. In the right panels we compare models with continuous IMF (curves) and discrete IMF (connected symbols) for clusters of different masses with ml = 0.1. Crosses indicate models with Mc = 104 m⊙, triangles Mc = 5 × 10³ m⊙, and diamonds Mc = 103 m⊙. As in the left panel, the curves for different Mc are artificially shifted vertically in order to avoid crowding.
Current usage metrics show cumulative count of Article Views (full-text article views including HTML views, PDF and ePub downloads, according to the available data) and Abstracts Views on Vision4Press platform.
Data correspond to usage on the plateform after 2015. The current usage metrics is available 48-96 hours after online publication and is updated daily on week days.
Initial download of the metrics may take a while.