Fig. 10
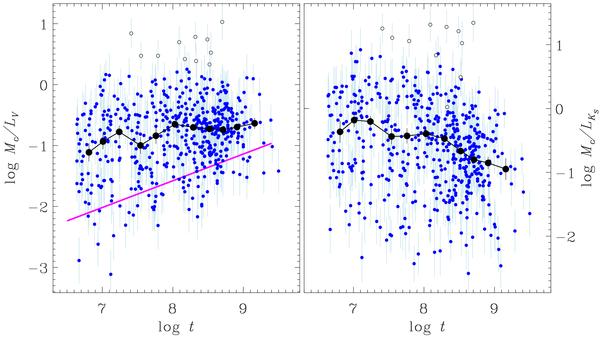
Observed mass-luminosity ratio vs. age of the Galactic open clusters in the optical (V) and NIR (Ks) photometric passbands. The dots are data for individual clusters, the bars indicate the individual errors in the data. The open dots mark extended clusters excluded from the analysis (see text). The large black dots show the running median of the M/L ratio computed with a (log t)-bin of 0.5 and a step of 0.25. The straight line in the left panel is the empirical relation from Battinelli et al. (1994).
Current usage metrics show cumulative count of Article Views (full-text article views including HTML views, PDF and ePub downloads, according to the available data) and Abstracts Views on Vision4Press platform.
Data correspond to usage on the plateform after 2015. The current usage metrics is available 48-96 hours after online publication and is updated daily on week days.
Initial download of the metrics may take a while.