Fig. 1
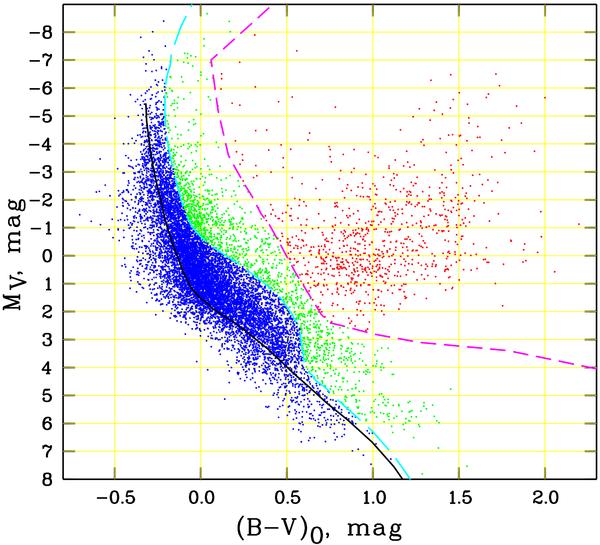
Empirical colour–magnitude diagram based on data from the ASCC-2.5 of the most probable cluster members used for the classification of 650 open clusters. The solid black curve is the empirical ZAMS of Schmidt-Kaler et al. (1982), the solid cyan curve is the TAMS taken from the Padova models, and the broken (magenta) curve separates the red giant domain from post-MS stars. The members located to the left of the TAMS are classified as main sequence stars (marked in blue colour), those located to the right of the broken line as red giants (red), and stars in between (green) are cluster members that have just left the main sequence, but are not yet red enough (post-MS stars).
Current usage metrics show cumulative count of Article Views (full-text article views including HTML views, PDF and ePub downloads, according to the available data) and Abstracts Views on Vision4Press platform.
Data correspond to usage on the plateform after 2015. The current usage metrics is available 48-96 hours after online publication and is updated daily on week days.
Initial download of the metrics may take a while.