Fig. 8
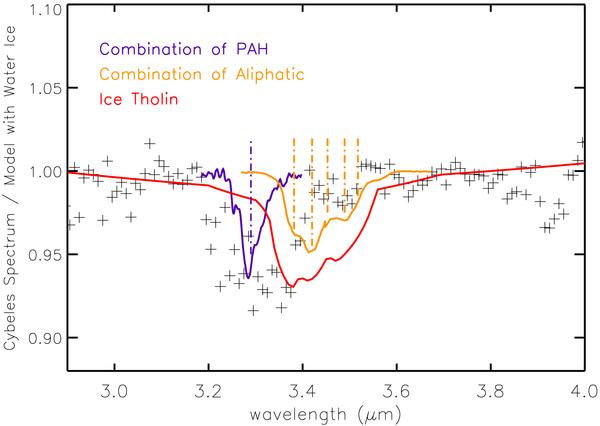
The residuals of dividing Cybele’s spectrum against the model are shown (as crosses) together with the spectra of organics with different composition. In yellow is the spectrum of a sample of Insoluble Organic Material from Orthous-Dauna et al. (2010) showing the contribution of the aliphatic structure. The purple line is the spectrum of an average of six polycyclic aromatic hydrocarbons from Colangeli et al. (1992).The red line is the spectrum of ice tholin from Khare et al. (1993).
Current usage metrics show cumulative count of Article Views (full-text article views including HTML views, PDF and ePub downloads, according to the available data) and Abstracts Views on Vision4Press platform.
Data correspond to usage on the plateform after 2015. The current usage metrics is available 48-96 hours after online publication and is updated daily on week days.
Initial download of the metrics may take a while.