Fig. 7
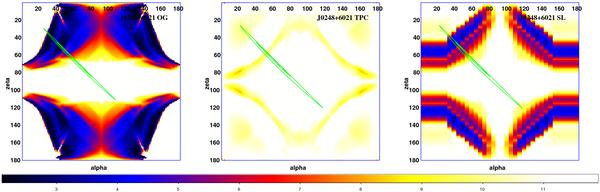
Pulsar geometry and emission modeling for PSR J0248+6021. Green contours show the rotating vector model fit to the radio polarization data (contours at δ(χ2/d.o.f.) = +0.25, +0.5 above the minimum χ2/d.o.f. of 1.6). The color backgrounds are χ3 maps of the fit to the observed >100 MeV pulse profile to the outer gap model (left), the two-pole caustic model (middle), and the separatrix layer model (right), for different values of the magnetic inclination, α, and the minimum angle to the line-of-sight, ζ (Romani & Watters 2010). Each panel has the same color scale, where dark colors represent better fits. The preferred models lie along the green RVM-selected band.
Current usage metrics show cumulative count of Article Views (full-text article views including HTML views, PDF and ePub downloads, according to the available data) and Abstracts Views on Vision4Press platform.
Data correspond to usage on the plateform after 2015. The current usage metrics is available 48-96 hours after online publication and is updated daily on week days.
Initial download of the metrics may take a while.