Fig. 12
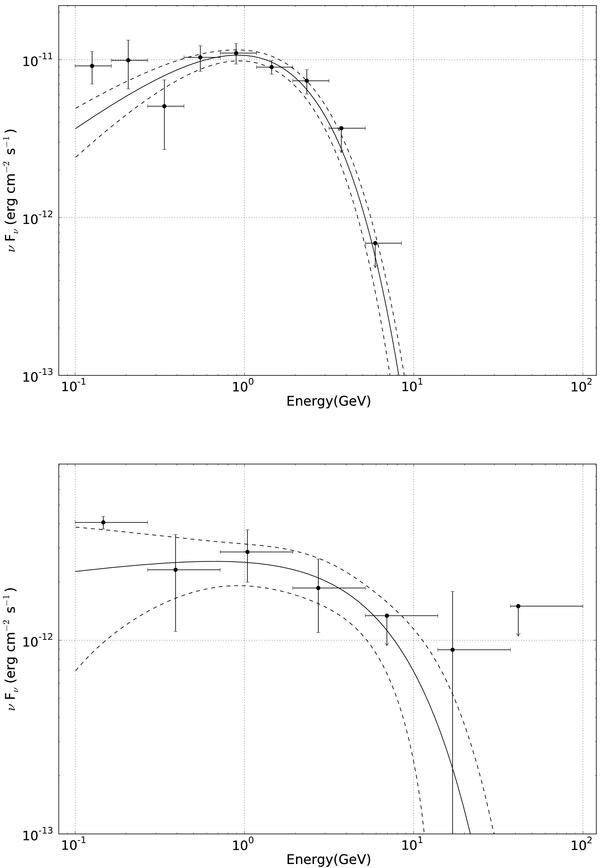
On-pulse gamma-ray spectral energy distributions (SEDs) obtained with the Fermi Large Area Telescope. Top: PSR J0248+6021, in the phase range 0.2 < φ < 0.55. Bottom: PSR J2240+5832 in the phase range 0.50 < φ < 0.75. Plotted points are from power-law likelihood fits to individual energy bands with ≥2σ detection significance above background for two degrees of freedom, otherwise an upper limit arrow is shown. The solid black line shows the maximum likelihood fit to a power law with exponential cutoff (Eq. (2)). The dashed lines are ±1σ uncertainties in the fit parameters.
Current usage metrics show cumulative count of Article Views (full-text article views including HTML views, PDF and ePub downloads, according to the available data) and Abstracts Views on Vision4Press platform.
Data correspond to usage on the plateform after 2015. The current usage metrics is available 48-96 hours after online publication and is updated daily on week days.
Initial download of the metrics may take a while.