Fig. 10
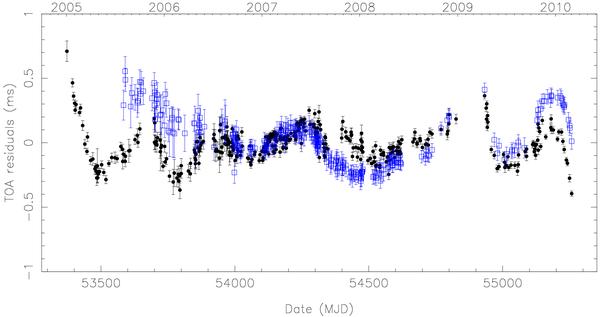
Time-of-arrival post-fit residuals for PSR J0248+6021, allowing for linear variations of dispersion measure over time, as in Fig. 9, but showing only data acquired with the BON backend. The 2.0 GHz data (blue squares) are clearly above the 1.4 GHz data (black dots) for the year 2006 and for 2009−2010, but below these data in 2008. We interpret the increasing, then decreasing DM value as evidence that the neutron star is moving through a dense environment.
Current usage metrics show cumulative count of Article Views (full-text article views including HTML views, PDF and ePub downloads, according to the available data) and Abstracts Views on Vision4Press platform.
Data correspond to usage on the plateform after 2015. The current usage metrics is available 48-96 hours after online publication and is updated daily on week days.
Initial download of the metrics may take a while.