Fig. 6
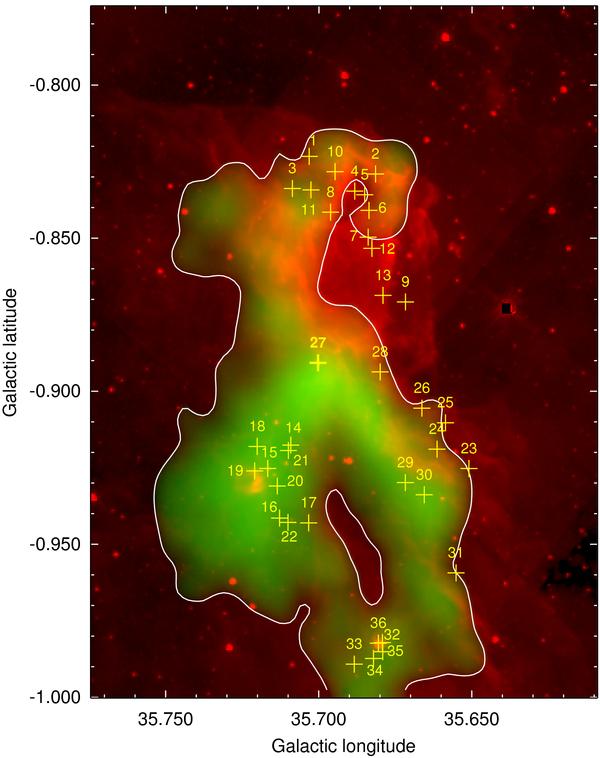
Two-color image: the 13CO emission integrated between 53 and 61 km s-1 is presented in green, and the 8 μm emission, in red. For sharper contrast, the 13CO emission scale is displayed in square root and bordered by a white contour. The yellow crosses indicate the position of the intrinsically red sources, i.e., sources satisfying the condition m4.5 − m8.0 + ε ≥ 1. We labeled the sources that appear to be related to the molecular gas around G35.6.
Current usage metrics show cumulative count of Article Views (full-text article views including HTML views, PDF and ePub downloads, according to the available data) and Abstracts Views on Vision4Press platform.
Data correspond to usage on the plateform after 2015. The current usage metrics is available 48-96 hours after online publication and is updated daily on week days.
Initial download of the metrics may take a while.