Free Access
Fig. 5
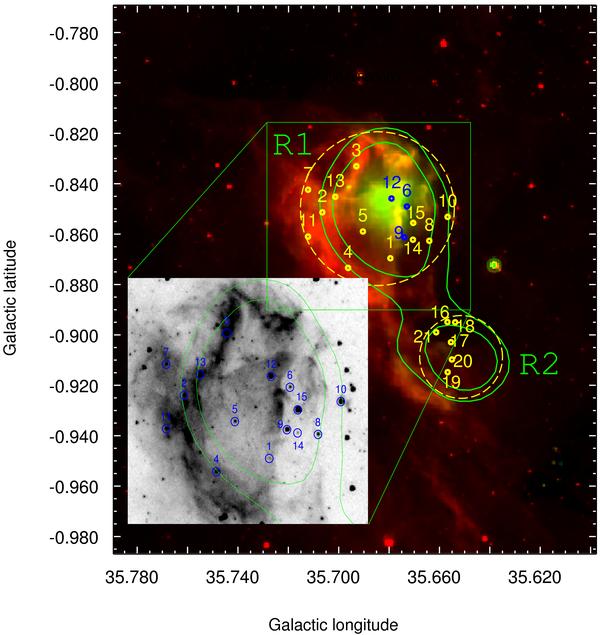
Spitzer-IRAC two-color image (8 μm = red and 24 μm = green). The green contours represent the radio continuum emission at 20 cm. The crosses show the location of the main sequence star candidates in R1 and R2 (dashed circles).
Current usage metrics show cumulative count of Article Views (full-text article views including HTML views, PDF and ePub downloads, according to the available data) and Abstracts Views on Vision4Press platform.
Data correspond to usage on the plateform after 2015. The current usage metrics is available 48-96 hours after online publication and is updated daily on week days.
Initial download of the metrics may take a while.