Fig. 3
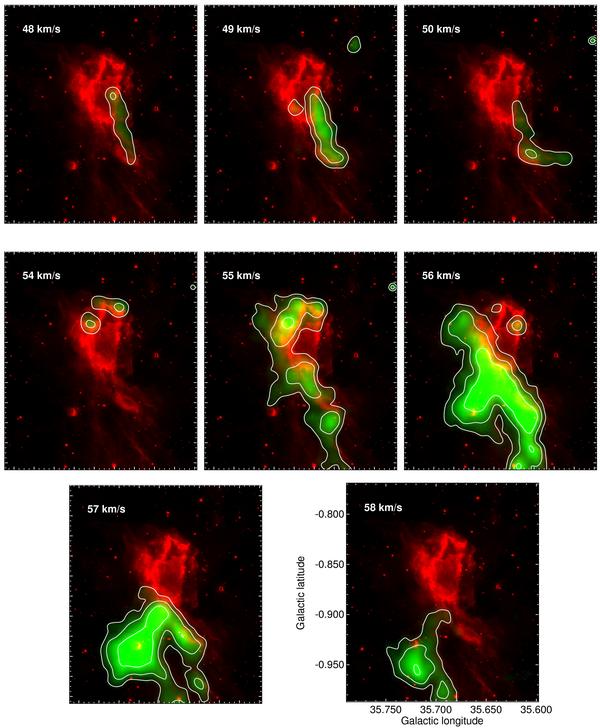
Integrated velocity channel maps of the 13CO J = 1–0 emission (in green) every ~1 km s-1 in two velocity intervals: from ~48 to 51 km s-1 (shown in the first three panels) and from ~54 to 59 km s-1 (shown in the remaining panels). The contour levels of the 13CO J = 1–0 emission are 1, 2 and 4 K km s-1. Red is the 8 μm emission.
Current usage metrics show cumulative count of Article Views (full-text article views including HTML views, PDF and ePub downloads, according to the available data) and Abstracts Views on Vision4Press platform.
Data correspond to usage on the plateform after 2015. The current usage metrics is available 48-96 hours after online publication and is updated daily on week days.
Initial download of the metrics may take a while.