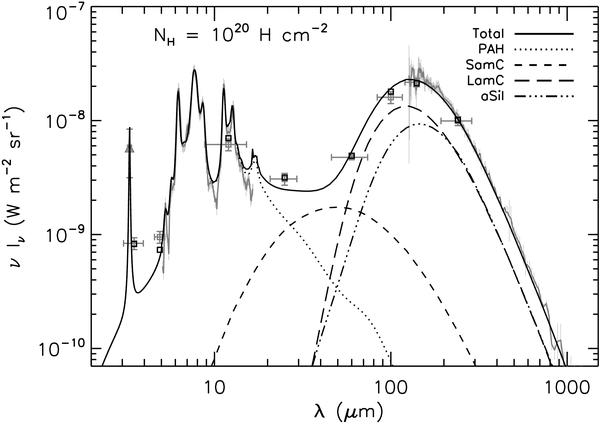
Fig. 2

Dust emission for the DHGL medium. Grey symbols and curves indicate the observed emission spectrum (see Sect. 4.1) for NH = 1020 H cm-2. The mid-IR (~5−15 μm) and far-IR (~100−1000 μm) spectra are from ISOCAM/CVF (ISO satellite) and FIRAS (COBE satellite), respectively. The triangle at 3.3 μm is a narrow band measurment from AROME balloon experiment. Squares are the photometric measurments from DIRBE (COBE). Black lines are the model output and black squares the modeled DIRBE points taking into account instrumental transmission and color corrections.
Current usage metrics show cumulative count of Article Views (full-text article views including HTML views, PDF and ePub downloads, according to the available data) and Abstracts Views on Vision4Press platform.
Data correspond to usage on the plateform after 2015. The current usage metrics is available 48-96 hours after online publication and is updated daily on week days.
Initial download of the metrics may take a while.


