Fig. 4
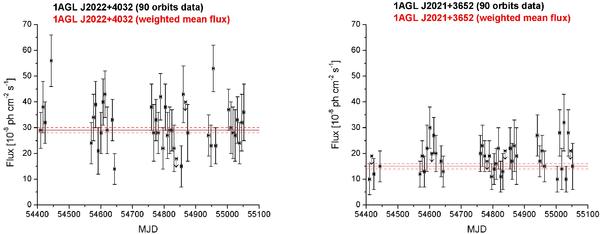
Flux for E ≥ 400 MeV on six-day time intervals from 1AGL J2022+4032 (left) and 1AGL J2021+3652 (right). The Red line indicates the weighted mean of the 42 individual fluxes, from which the χ2 was calculated: (29 ± 1) × 10-8 photons cm-2 s-1 for 1AGL J2022+4032, and (15 ± 1) × 10-8 photons cm-2 s-1 for 1AGL J2021+3652.
Current usage metrics show cumulative count of Article Views (full-text article views including HTML views, PDF and ePub downloads, according to the available data) and Abstracts Views on Vision4Press platform.
Data correspond to usage on the plateform after 2015. The current usage metrics is available 48-96 hours after online publication and is updated daily on week days.
Initial download of the metrics may take a while.