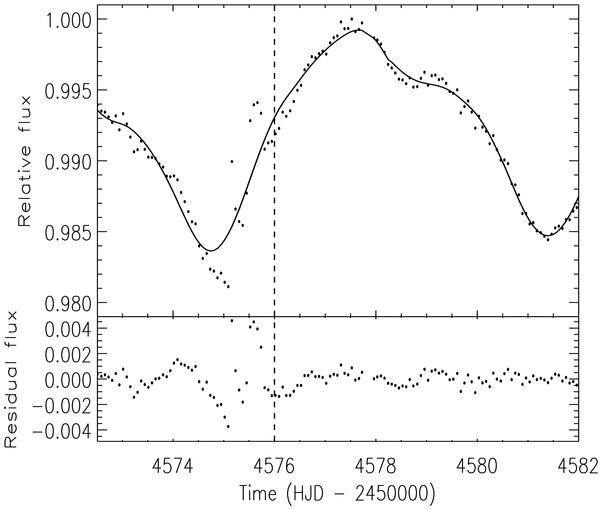
Fig. 2

Upper panel: the out-of-transit light curve of CoRoT-6 (dots) in the time interval between HJD 2454572.5075 and 2454582.0 and its unregularized best fit for a facular-to-spotted area ratio of Q = 1.5 (solid line). The flux is normalized to the maximum at HJD 2454577.5245. Lower panel: the corresponding residuals. Note the greater residuals before HJD 2454576.0 (marked by the vertical dashed line) owing to the rapid evolution of some active regions.
Current usage metrics show cumulative count of Article Views (full-text article views including HTML views, PDF and ePub downloads, according to the available data) and Abstracts Views on Vision4Press platform.
Data correspond to usage on the plateform after 2015. The current usage metrics is available 48-96 hours after online publication and is updated daily on week days.
Initial download of the metrics may take a while.


