Fig. 5
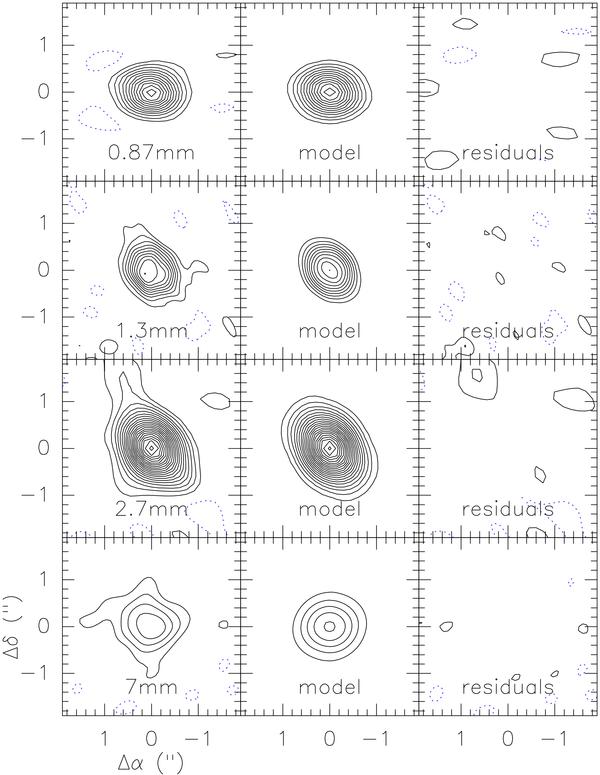
Comparison between the observed images at 0.87 mm, 1.3 mm, 2.7 mm and 7 mm (left panels, from top to bottom) and the images corresponding to the best fit model at each wavelength obtained by sampling the model visibilities at the same locations and with the same noise as for the observed data (middle panels). The images derived by the difference from the observed and model visibilities are shown on the right panels. At each wavelength the contours are the same in all three plots and correspond to −2σ and from 2σ to the peak value spaced by 2σ, where σ is the rms measured in the observed map (see also Fig. 1).
Current usage metrics show cumulative count of Article Views (full-text article views including HTML views, PDF and ePub downloads, according to the available data) and Abstracts Views on Vision4Press platform.
Data correspond to usage on the plateform after 2015. The current usage metrics is available 48-96 hours after online publication and is updated daily on week days.
Initial download of the metrics may take a while.