Fig. 4
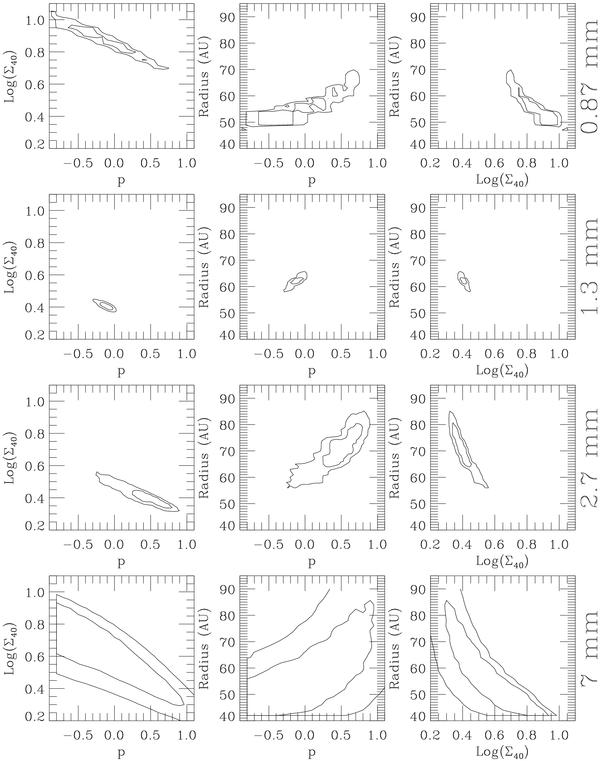
χ2 hypercube projections on the (p,Log10(Σ40)), (p, Rout), and (Log10(Σ40), Rout) planes, to produce each plot we have chosen the value of the other parameters corresponding to the minimum of χ2 at each position on the planes shown. Contours represent the 68% and 95% confidence levels for the fit. In each row we show the results for the fit at a given wavelength, from top to bottom ar 0.87 mm, 1.3 mm, 2.7 mm and 7 mm (as labelled to the right).
Current usage metrics show cumulative count of Article Views (full-text article views including HTML views, PDF and ePub downloads, according to the available data) and Abstracts Views on Vision4Press platform.
Data correspond to usage on the plateform after 2015. The current usage metrics is available 48-96 hours after online publication and is updated daily on week days.
Initial download of the metrics may take a while.