Fig. 1
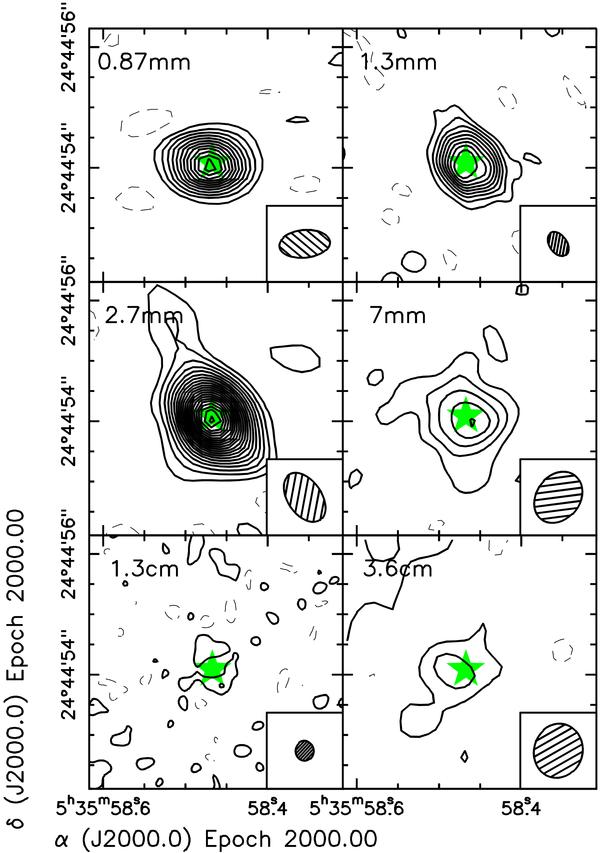
CQ Tau continuum maps in mm-cm bands from our new high angular resolution data (from top left to bottom right): 0.87 mm, 1.3 mm, 2.7 mm, 7 mm (from Testi et al. 2003), 1.3 cm, 3.6 cm maps. In each plot the position of the central star and the beam ellipse are shown. Contours levels are spaced by 2σ where σ is 9 mJy at 0.87 mm, 1 mJy at 1.3 mm, 0.3 mJy at 2.7 mm, 0.1 mJy at 7 mm, 0.02 mJy at 1.3 cm and 0.009 mJy at 3.6 cm. All maps have been corrected from their original epoch to the epoch 2000.0, using the proper motion of the optical star as measured by Hipparcos (RA: 2.67, Dec: –26.17 mas/year), the star is also plotted at the epoch 2000.0 coordinates, as given by Simbad at CDS.
Current usage metrics show cumulative count of Article Views (full-text article views including HTML views, PDF and ePub downloads, according to the available data) and Abstracts Views on Vision4Press platform.
Data correspond to usage on the plateform after 2015. The current usage metrics is available 48-96 hours after online publication and is updated daily on week days.
Initial download of the metrics may take a while.