Free Access
Fig. 2
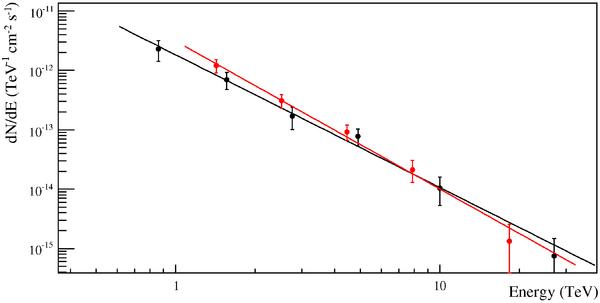
The VHE spectrum observed from HESS J1507-622. The black line represents the best χ2 fit of a power law to observed data using the standard cuts, whereas the red line shows the spectral result using hard cuts as described in Aharonian et al. (2006c).
Current usage metrics show cumulative count of Article Views (full-text article views including HTML views, PDF and ePub downloads, according to the available data) and Abstracts Views on Vision4Press platform.
Data correspond to usage on the plateform after 2015. The current usage metrics is available 48-96 hours after online publication and is updated daily on week days.
Initial download of the metrics may take a while.