Free Access
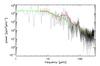
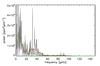
Fig. 6
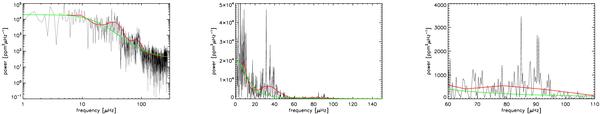
Power spectra of a target (KIC4813971) on CCD 2 showing power excess due to solar-like oscillations at frequencies around 35 μHz and the artefact due to desaturation around 87 μHz. The red line indicates a binned power spectrum and the green line a fit to the background.
This figure is made of several images, please see below:
Current usage metrics show cumulative count of Article Views (full-text article views including HTML views, PDF and ePub downloads, according to the available data) and Abstracts Views on Vision4Press platform.
Data correspond to usage on the plateform after 2015. The current usage metrics is available 48-96 hours after online publication and is updated daily on week days.
Initial download of the metrics may take a while.