Free Access
Fig. 3
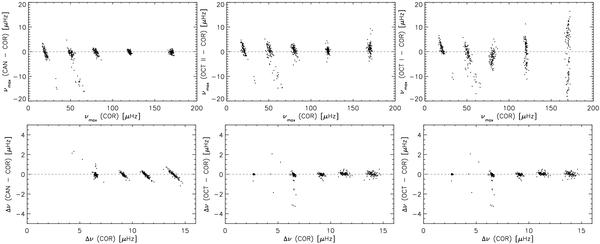
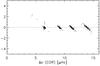
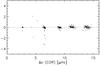
The differences in the simulation results between different methods, from left to right CAN-COR, OCT II-COR, OCT I-COR are shown as a function of the value returned by COR. The top row is for νmax and the bottom row for Δν. The gray dashed line indicates agreement between the methods.
This figure is made of several images, please see below:

Current usage metrics show cumulative count of Article Views (full-text article views including HTML views, PDF and ePub downloads, according to the available data) and Abstracts Views on Vision4Press platform.
Data correspond to usage on the plateform after 2015. The current usage metrics is available 48-96 hours after online publication and is updated daily on week days.
Initial download of the metrics may take a while.