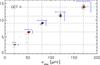
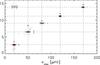
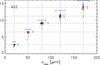
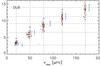
Fig. 2
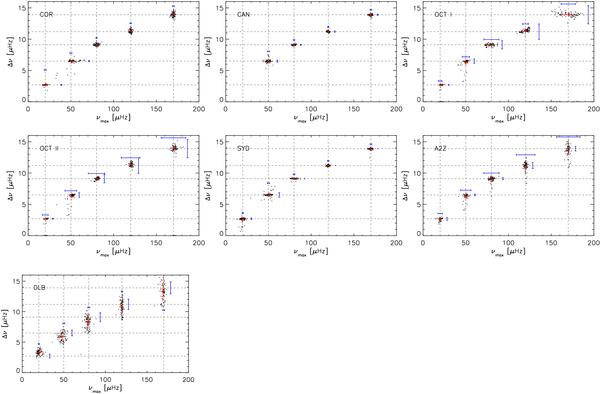
Results for νmax and Δν of the analysis of synthetic time series using different methods: COR, CAN, OCT I, OCT II, SYD, A2Z and DLB. The black dots indicate the values obtained by the methods for each individual realization, the red asterisks indicate the mean value and scatter of these results. The typical uncertainties on the computed values for each model are indicated with the blue error bars. The gray dashed lines indicate the input values.
Current usage metrics show cumulative count of Article Views (full-text article views including HTML views, PDF and ePub downloads, according to the available data) and Abstracts Views on Vision4Press platform.
Data correspond to usage on the plateform after 2015. The current usage metrics is available 48-96 hours after online publication and is updated daily on week days.
Initial download of the metrics may take a while.