Fig. 1
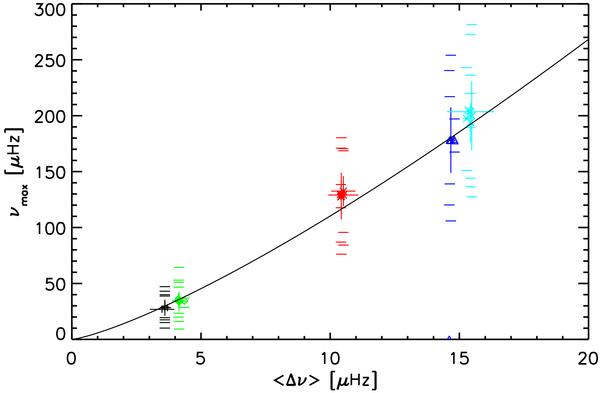
νmax versus ⟨ Δν ⟩ for five stars observed with Kepler. For each star all results are plotted with the uncertainties derived by the different methods. The ranges in frequency over which ⟨ Δν ⟩ values are computed are indicated with the horizontal lines above and below the results. A different colour and symbol are used for results of each star. The black solid line indicates the approximate relation between ⟨ Δν ⟩ and νmax.
Current usage metrics show cumulative count of Article Views (full-text article views including HTML views, PDF and ePub downloads, according to the available data) and Abstracts Views on Vision4Press platform.
Data correspond to usage on the plateform after 2015. The current usage metrics is available 48-96 hours after online publication and is updated daily on week days.
Initial download of the metrics may take a while.