Fig. 10
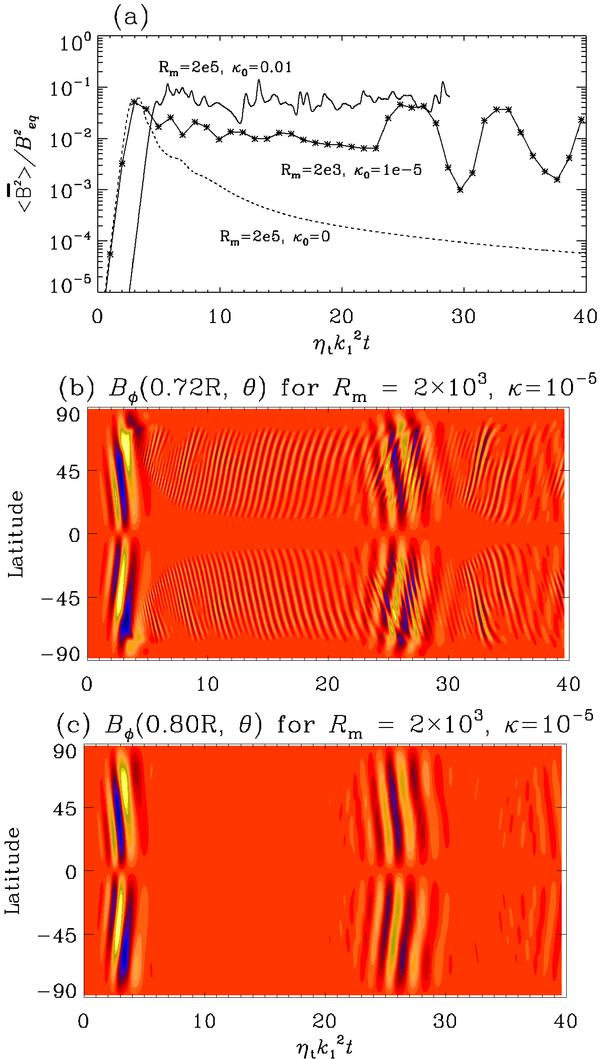
a) Time evolution of the volume averaged magnetic energy in the domain scaled with the equipartition energy for models with Rm = 2 × 10³ and κ0 = 10-5 (∗ ) as well as with Rm = 2 × 10⁵ and κ0 = 10-5 (solid line) for the interface dynamo model of Sect. 3.1 with dynamical α quenching. The saturation curve for zero fluxes for the model with Rm = 2 × 10⁵ has been shown by the dashed line; b) and c) show time-latitude diagrams for the toroidal field at the depths indicated for models with Rm = 2 × 10³ and κ0 = 10-5.
Current usage metrics show cumulative count of Article Views (full-text article views including HTML views, PDF and ePub downloads, according to the available data) and Abstracts Views on Vision4Press platform.
Data correspond to usage on the plateform after 2015. The current usage metrics is available 48-96 hours after online publication and is updated daily on week days.
Initial download of the metrics may take a while.