Fig. 8
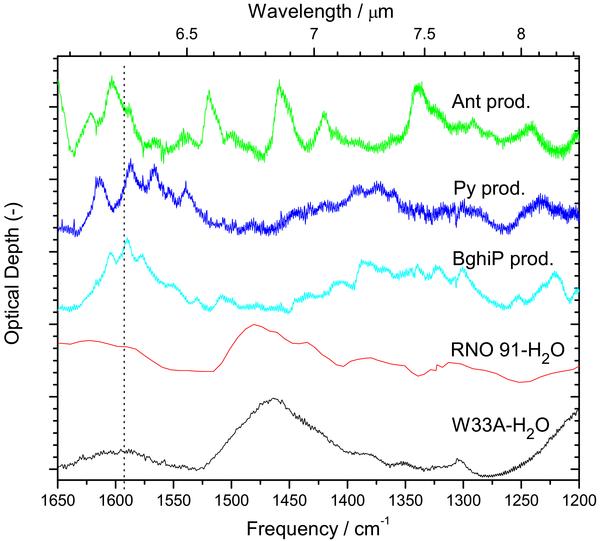
The 6.1–8.3 μm (1650 cm-1–1200 cm-1) region of the spectra of W33A and RNO 91 after subtraction of the H2O bending and librational overtone contributions plotted in absorbance compared to the spectra of the products after 180 min of PAH:H2O ice photolysis. The dotted line guides the eye to the ~6.2 μm ice absorption and main PAH:H2O ice photoproduct bands.
Current usage metrics show cumulative count of Article Views (full-text article views including HTML views, PDF and ePub downloads, according to the available data) and Abstracts Views on Vision4Press platform.
Data correspond to usage on the plateform after 2015. The current usage metrics is available 48-96 hours after online publication and is updated daily on week days.
Initial download of the metrics may take a while.