Fig. 8
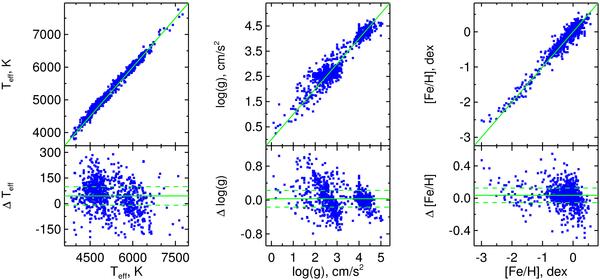
Comparison of the atmospheric parameters determined by us (ordinates of the upper panels) with those from Valdes (abscissas). 818 FGK stars are plotted and 46 temperature, eight log g and five [Fe/H] outliers are not displayed. In the lower panels, we plot the differences between the values from ULySS and the literature (here Valdes). The green lines in the upper panels are the 1 to 1 ratios. In the lower panels, the continuous green lines mark the mean bias, and the dashed lines are the 1-σ deviation (computed after the rejection of the Teff outliers). The same convention is used from Fig. A.1 to C.4 for other literature sources.
Current usage metrics show cumulative count of Article Views (full-text article views including HTML views, PDF and ePub downloads, according to the available data) and Abstracts Views on Vision4Press platform.
Data correspond to usage on the plateform after 2015. The current usage metrics is available 48-96 hours after online publication and is updated daily on week days.
Initial download of the metrics may take a while.