Fig. B.4
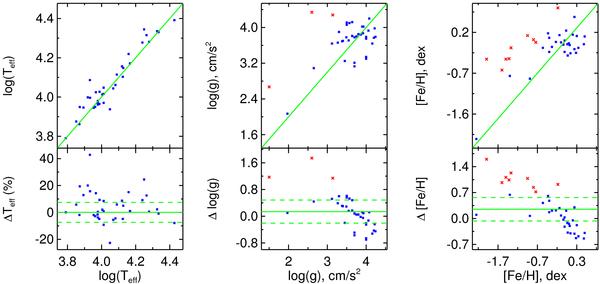
Comparison of the atmospheric parameters determined by us with those from Cenarro et al. (2007). We plot 37 B and A type stars in common between the two data sets. One Teff outlier is not displayed. Three log g and nine [Fe/H] deviating measurements are displayed as red crosses and discussed in the text. The axes are as in Fig. 8, besides Teff is in log10.
Current usage metrics show cumulative count of Article Views (full-text article views including HTML views, PDF and ePub downloads, according to the available data) and Abstracts Views on Vision4Press platform.
Data correspond to usage on the plateform after 2015. The current usage metrics is available 48-96 hours after online publication and is updated daily on week days.
Initial download of the metrics may take a while.