Fig. 2
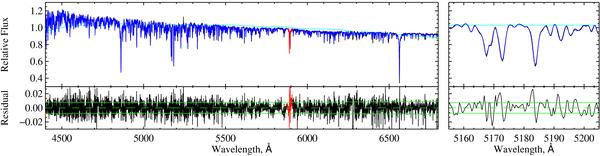
Fit of the CFLIB observation HD 4307 (G2V) with a TGM component. The top panel shows the spectrum (in black) and the best fit in blue (both are almost superimposed and the black line can be seen only when zooming on the figure), the light blue is the multiplicative polynomial. In red we plot the flagged and masked NaD telluric lines that were not well calibrated in ELODIE library. The residuals are plotted in the bottom panels. The continuous green lines mark the 1-σ deviation, and the dashed line is the zero-axis. The right side shows a small wavelength region around Mgb. The order of the multiplicative polynomial is n = 70.
Current usage metrics show cumulative count of Article Views (full-text article views including HTML views, PDF and ePub downloads, according to the available data) and Abstracts Views on Vision4Press platform.
Data correspond to usage on the plateform after 2015. The current usage metrics is available 48-96 hours after online publication and is updated daily on week days.
Initial download of the metrics may take a while.