Fig. 5
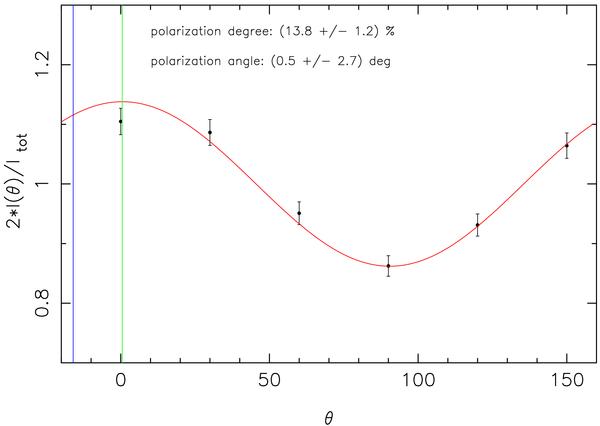
IRS 21 in 2005 (Wollaston). The plot shows the intensity divided by Itot/2 as a function of angle θ (as defined in Eq. (3)). The data are obtained from mosaics. No calibration was applied. The green line marks the measured polarization angle, the blue the published angle (9.8%@14°) from Ott et al. (1999). In this plot the angle is counted in the instrument sense (negative with respect to sky).
Current usage metrics show cumulative count of Article Views (full-text article views including HTML views, PDF and ePub downloads, according to the available data) and Abstracts Views on Vision4Press platform.
Data correspond to usage on the plateform after 2015. The current usage metrics is available 48-96 hours after online publication and is updated daily on week days.
Initial download of the metrics may take a while.