Fig. 10
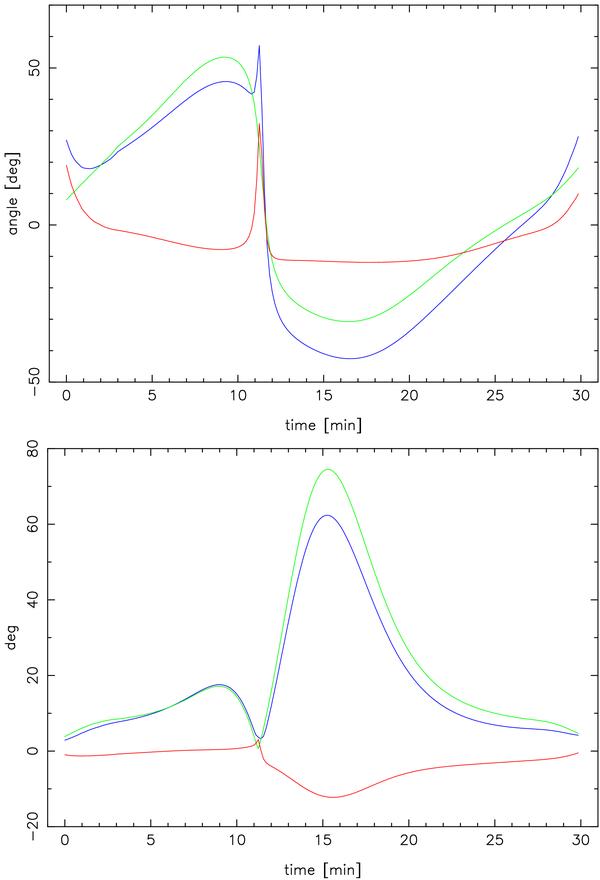
Simulation of systematic calibration artefacts in light curves. The green curves show a typical pattern for polarization degree and angle as a function of time (Zamaninasab et al. 2010). The blue curves show the same data calibrated by the described “boot strapping” method. The difference between both is displayed in red.
Current usage metrics show cumulative count of Article Views (full-text article views including HTML views, PDF and ePub downloads, according to the available data) and Abstracts Views on Vision4Press platform.
Data correspond to usage on the plateform after 2015. The current usage metrics is available 48-96 hours after online publication and is updated daily on week days.
Initial download of the metrics may take a while.