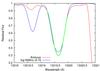
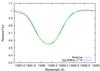
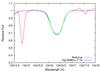
Fig. 4
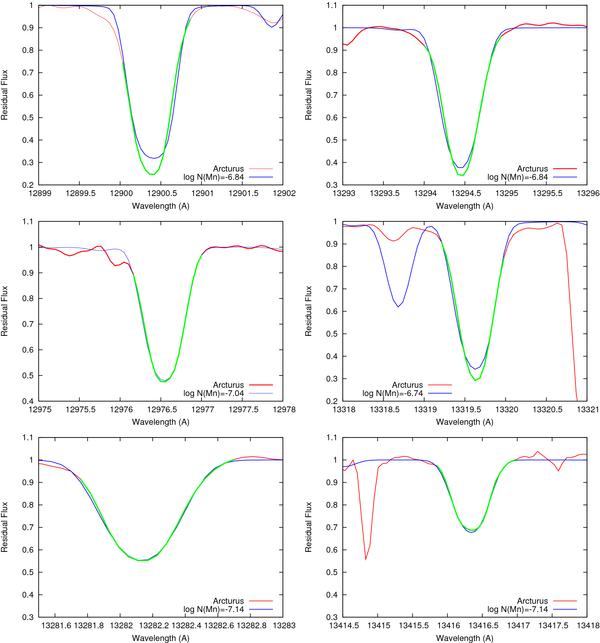
The best fits to the observed Arcturus spectrum features found from the minima of Eq. (3) for Mn i lines at 12 899 Å, 12 975 Å, 13 281 Å (left column) and 13 293 Å, 13 318 Å, 13 415 Å (right column). The green line shows the section of the observed profile used to determine manganese abundance. The wavelength scale is taken from the observed spectrum of Arcturus.
Current usage metrics show cumulative count of Article Views (full-text article views including HTML views, PDF and ePub downloads, according to the available data) and Abstracts Views on Vision4Press platform.
Data correspond to usage on the plateform after 2015. The current usage metrics is available 48-96 hours after online publication and is updated daily on week days.
Initial download of the metrics may take a while.