Fig. 4
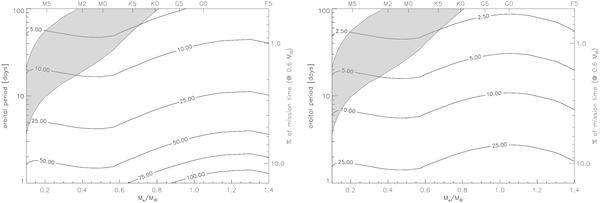
S/N on the detection of the 4.3 μm CO2 band in a super earth at 10 pc, summing the observations of all of the primary transits available on average over the 5 year mission time. For this and all following S/N plots: left plot is with stellar noise only and right plot is with instrumental (here NIRSpec) and zodiacal noises. For this plot and following cases of observations over the whole mission time (super earths): a) the habitable zone is plotted in gray, b) the fraction of the mission time, accounting for 2 transit durations (“1/2 out + in + 1/2 out-of-transit”), plus the fixed 65 min JWST slew time, is on the right axis.
Current usage metrics show cumulative count of Article Views (full-text article views including HTML views, PDF and ePub downloads, according to the available data) and Abstracts Views on Vision4Press platform.
Data correspond to usage on the plateform after 2015. The current usage metrics is available 48-96 hours after online publication and is updated daily on week days.
Initial download of the metrics may take a while.