Fig. 12
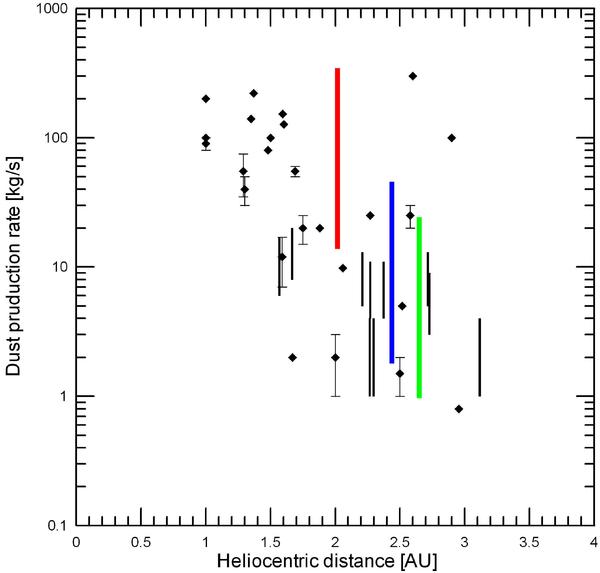
Dust mass loss rate for short period comets. The black symbols are for single measurements, the black thin vertical lines correspond to a range assigned to the comet, depending on its classification: “typical” or “depleted”, based on their abundances in carbon-chain species (following the classification by A’Hearn et al. 1985). Values have been found in literature for comets 2P/Encke (Epifani et al. 2001), 4P/Faye (Lamy et al. 2009), 10P/Tempel 2 (Lamy et al. 2009), 17P/Holmes (Lamy et al. 2009), 21P/Grigg-Skjellerup (Fulle et al. 1993), 37P/Forbes (Lamy et al. 2009), 37PForbes (Newburn & Spinrad 1985), 44P/Reinmuth 2 (Lamy et al. 2009), 46P/Wirtanen (Colangeli et al. 1998), 50P/Arend (Lamy et al. 2009), 59P/Kearns-Kwee (Lamy et al. 2009), 59P/Kearns-Kwee (Newburn & Spinrad 1985), 63P/Wild 1 (Lamy et al. 2009), 63P/Wild 1 (Colangeli et al. 1998), 67P/Churyumov-Gerasimenko (Hanner et al. 1985; Fulle et al. 2004), 71P/Clark (Lamy et al. 2009), 84P/Giclas (Lamy et al. 2009), 103P/Hartley 2 (Epifani et al. 2001), 106P/Shuster (Lamy et al. 2009), 112P/Urata Nijima (Lamy et al. 2009), 114P/Wiseman-Skiff (Lamy et al. 2009). The thick vertical lines are for the model dust mass loss rate of comets presented in this paper, giving ranges for a grain velocity between 1 and 25 m/s. Thick blue line: 32P/Comas Solá; thick green line: 56P/Slaughter-Burnham; thick red line: 78P/Gerhels 2.
Current usage metrics show cumulative count of Article Views (full-text article views including HTML views, PDF and ePub downloads, according to the available data) and Abstracts Views on Vision4Press platform.
Data correspond to usage on the plateform after 2015. The current usage metrics is available 48-96 hours after online publication and is updated daily on week days.
Initial download of the metrics may take a while.