Fig. 6
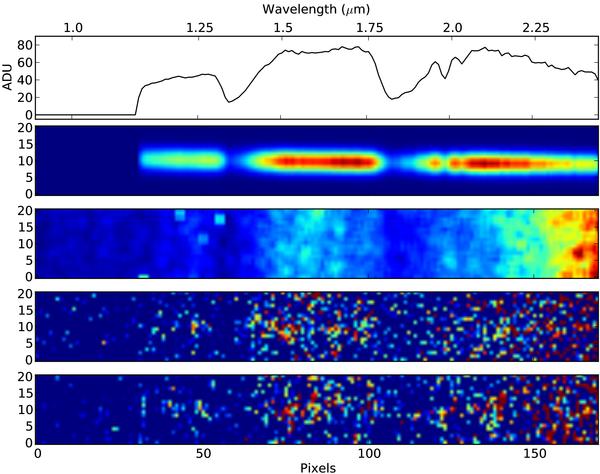
The best-fit spectrum, convolved with the instrument response. It is shown in the top panel as a one-dimensional spectrum and as a clean two-dimensional array in the second one. The third panel shows a 1σ noise two-dimensional array in the CCD area corresponding to the afterglow spectrum, as described in Sect. 3.2.2. The fourth panel shows one realisation of the CCD noise plus the best-fit spectrum, which can be directly compared to the real data at the bottom panel. The contrast scale is the same in the two last panels, but not in the previous ones.
Current usage metrics show cumulative count of Article Views (full-text article views including HTML views, PDF and ePub downloads, according to the available data) and Abstracts Views on Vision4Press platform.
Data correspond to usage on the plateform after 2015. The current usage metrics is available 48-96 hours after online publication and is updated daily on week days.
Initial download of the metrics may take a while.