Free Access
Fig. 2
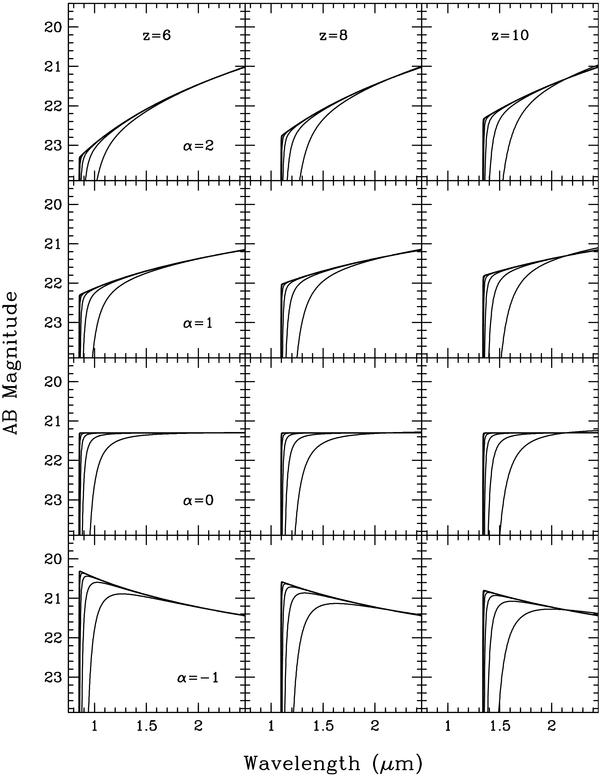
Some of the templates used for the analysis. Each column corresponds to a different redshift as labelled in the top panels, and each line to a different spectral slope, as labelled on the leftmost column. Within each panel, the different curves correspond to values of log [N(HI)] varying from 19 to 24 in steps of one.
Current usage metrics show cumulative count of Article Views (full-text article views including HTML views, PDF and ePub downloads, according to the available data) and Abstracts Views on Vision4Press platform.
Data correspond to usage on the plateform after 2015. The current usage metrics is available 48-96 hours after online publication and is updated daily on week days.
Initial download of the metrics may take a while.