Free Access
Fig. 6
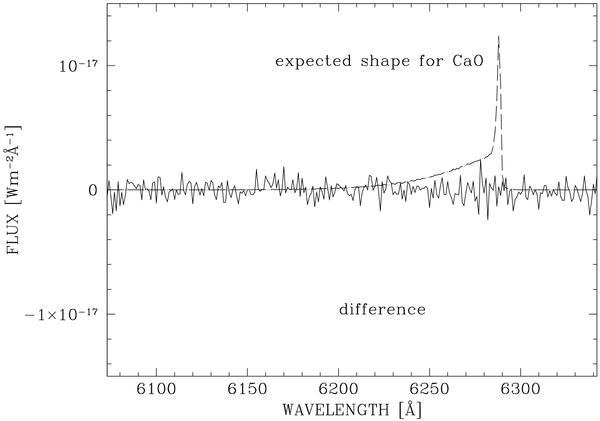
Difference of the spectra taken in- and out-of-transit shown in Fig. 5 after resampling the spectrum to a resolution of 55 km s-1. The dashed line demonstrates how the CaO-lines would look.
Current usage metrics show cumulative count of Article Views (full-text article views including HTML views, PDF and ePub downloads, according to the available data) and Abstracts Views on Vision4Press platform.
Data correspond to usage on the plateform after 2015. The current usage metrics is available 48-96 hours after online publication and is updated daily on week days.
Initial download of the metrics may take a while.