Free Access
Fig. 3
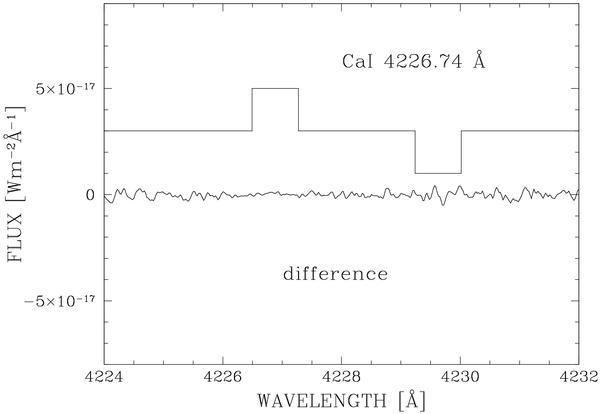
Difference between the two spectra shown in Fig. 2, together with the expected position of the lines from CoRoT-7b. Box pointing upwards indicates the expected position of the line during transit. Box pointing downwards indicates the expected position of the line in the out-of-transit observation.
Current usage metrics show cumulative count of Article Views (full-text article views including HTML views, PDF and ePub downloads, according to the available data) and Abstracts Views on Vision4Press platform.
Data correspond to usage on the plateform after 2015. The current usage metrics is available 48-96 hours after online publication and is updated daily on week days.
Initial download of the metrics may take a while.