Fig. 4
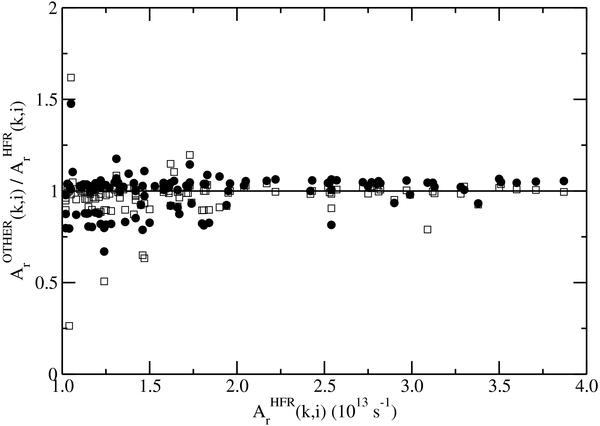
Comparison of HFR transition probabilities (1013 s-1),
 , with AUTOSTRUCTURE and
MCDF values for strong Al K lines
(Ar(k,i) ≥ 1013 s-1).
The A-value ratios,
, with AUTOSTRUCTURE and
MCDF values for strong Al K lines
(Ar(k,i) ≥ 1013 s-1).
The A-value ratios,  , with respect to HFR are
plotted. The full circles and open squares represent AUTOSTRUCTURE and MCDF values,
respectively. A straight line of equality has been drawn.
, with respect to HFR are
plotted. The full circles and open squares represent AUTOSTRUCTURE and MCDF values,
respectively. A straight line of equality has been drawn.
Current usage metrics show cumulative count of Article Views (full-text article views including HTML views, PDF and ePub downloads, according to the available data) and Abstracts Views on Vision4Press platform.
Data correspond to usage on the plateform after 2015. The current usage metrics is available 48-96 hours after online publication and is updated daily on week days.
Initial download of the metrics may take a while.