Fig. 4
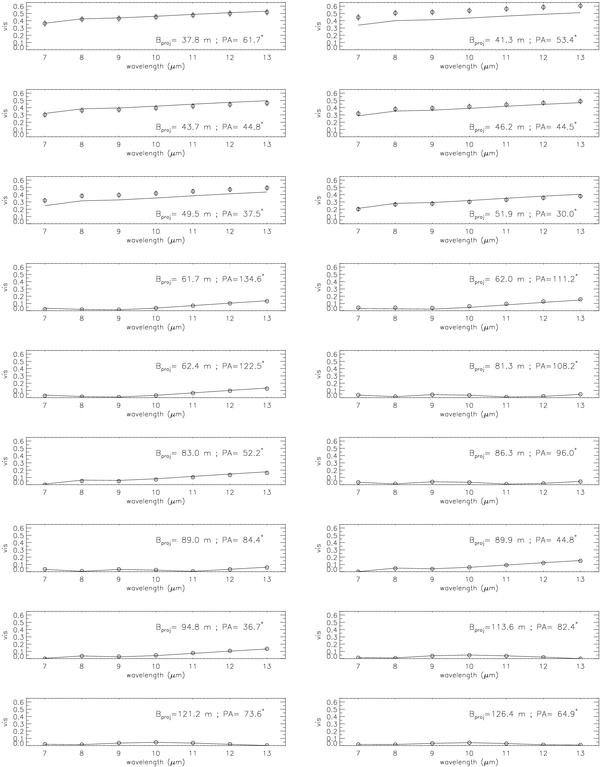
Visibilities of the artificial sgB[e] circumstellar environment (model a). The visibility variations with the wavelength are shown for each baseline specified by the value of the projected baseline and the position angle on the sky. The circles represent the simulated observations, and the solid curves represent the best-fit model.
Current usage metrics show cumulative count of Article Views (full-text article views including HTML views, PDF and ePub downloads, according to the available data) and Abstracts Views on Vision4Press platform.
Data correspond to usage on the plateform after 2015. The current usage metrics is available 48-96 hours after online publication and is updated daily on week days.
Initial download of the metrics may take a while.