Fig. 7
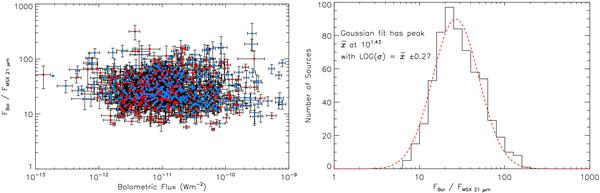
Left: the distribution of FBol/FMSX 21 as a function of FBol for all YSOs and H ii regions (red and blue respectively in the online version of this figure). Error bars are shown in black in order to give an idea of the total variation in values. Right: the histogram of FBol/FMSX 21 for all sources with MIPS data. A Gaussian is fitted to the data is shown by the dashed line.
Current usage metrics show cumulative count of Article Views (full-text article views including HTML views, PDF and ePub downloads, according to the available data) and Abstracts Views on Vision4Press platform.
Data correspond to usage on the plateform after 2015. The current usage metrics is available 48-96 hours after online publication and is updated daily on week days.
Initial download of the metrics may take a while.