Fig. 4
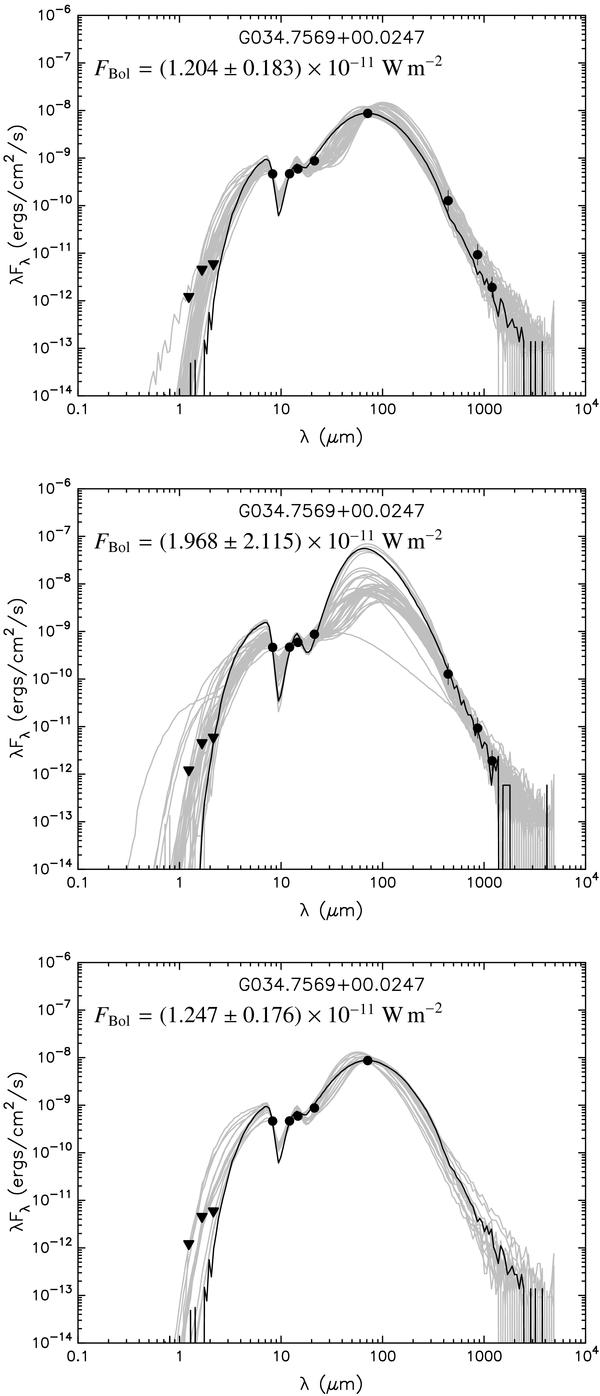
SED fits with different data sets included. Top: all data included. Middle: all data except MIPSGAL. Bottom: all data except sub-mm and mm. Bottom right: all data except 2MASS. The lines and points have the same meaning as in Fig. 1. The bolometric flux derived for each data set is indicated on the plot.
Current usage metrics show cumulative count of Article Views (full-text article views including HTML views, PDF and ePub downloads, according to the available data) and Abstracts Views on Vision4Press platform.
Data correspond to usage on the plateform after 2015. The current usage metrics is available 48-96 hours after online publication and is updated daily on week days.
Initial download of the metrics may take a while.