Fig. 2
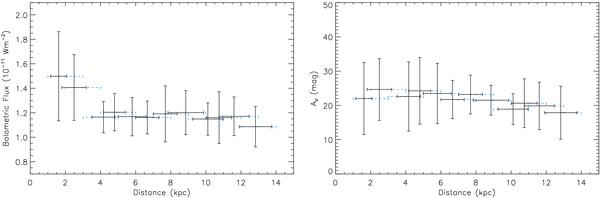
Bolometric flux (left) and AV (right) vs. the mean model distance obtained from SED fits with specified model distances d ± 1.0 kpc with d varying between 2 kpc and 13 kpc for the data of G034.7569+00.0247. The black horizontal error bars indicate the uncertainty on the mean model distance while the dashed horizontal error bars indicate the range of allowed model distances.
Current usage metrics show cumulative count of Article Views (full-text article views including HTML views, PDF and ePub downloads, according to the available data) and Abstracts Views on Vision4Press platform.
Data correspond to usage on the plateform after 2015. The current usage metrics is available 48-96 hours after online publication and is updated daily on week days.
Initial download of the metrics may take a while.