Fig. 12
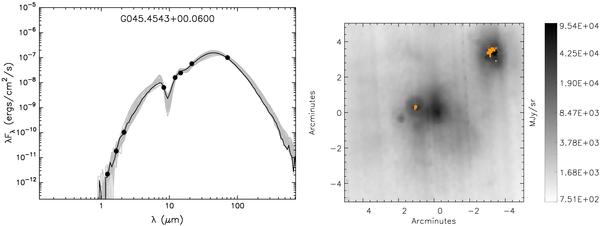
SED (left) and MIPSGAL 70 μm image (right) for the H ii region G045.4543+00.0600, for which we derive a luminosity of (3.7 ± 1.0) × 105 L⊙ while Wood & Churchwell (1989) derive a luminosity, after correction to our distance of 7.3 kpc, of 8.2 × 10⁵ L⊙ using IRAS far-IR data. The RMS source is merged with the source to the east (IRAS 19120+1103) in IRAS data and has a PSC 60 μm flux of 5340 Jy compared to a MIPS 70 μm flux of 2402 Jy, accounting for much of the remaining difference in luminosity measurements. Saturated pixels are indicated in yellow in the online version of this figure. For the SED, the lines and points have the same meaning as in Fig. 1.
Current usage metrics show cumulative count of Article Views (full-text article views including HTML views, PDF and ePub downloads, according to the available data) and Abstracts Views on Vision4Press platform.
Data correspond to usage on the plateform after 2015. The current usage metrics is available 48-96 hours after online publication and is updated daily on week days.
Initial download of the metrics may take a while.