Fig. 8
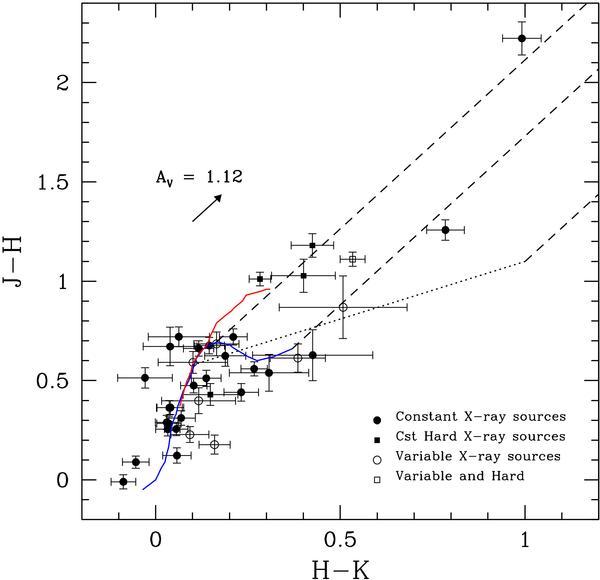
J − H versus H − K colour–colour diagram. All X-ray sources with an infrared counterpart (with 2MASS photometric colours) are plotted along with their errors (one standard deviation). The colours have been converted to the standard system. The heavy solid lines represent the intrinsic locus of main sequence stars (lower branch) and of giant stars (upper branch). The reddening band for these first stars is delimited by the two upper dashed lines. The dotted line represents the expected locus of dereddened colours for classical T Tauri stars, whereas the lower right dashed line symbolizes the reddening of these pre-main sequence stars. The arrow gives the direction of the interstellar reddening and its amplitude corresponds to the adopted average extinction towards the Carina region.
Current usage metrics show cumulative count of Article Views (full-text article views including HTML views, PDF and ePub downloads, according to the available data) and Abstracts Views on Vision4Press platform.
Data correspond to usage on the plateform after 2015. The current usage metrics is available 48-96 hours after online publication and is updated daily on week days.
Initial download of the metrics may take a while.