Fig. 6
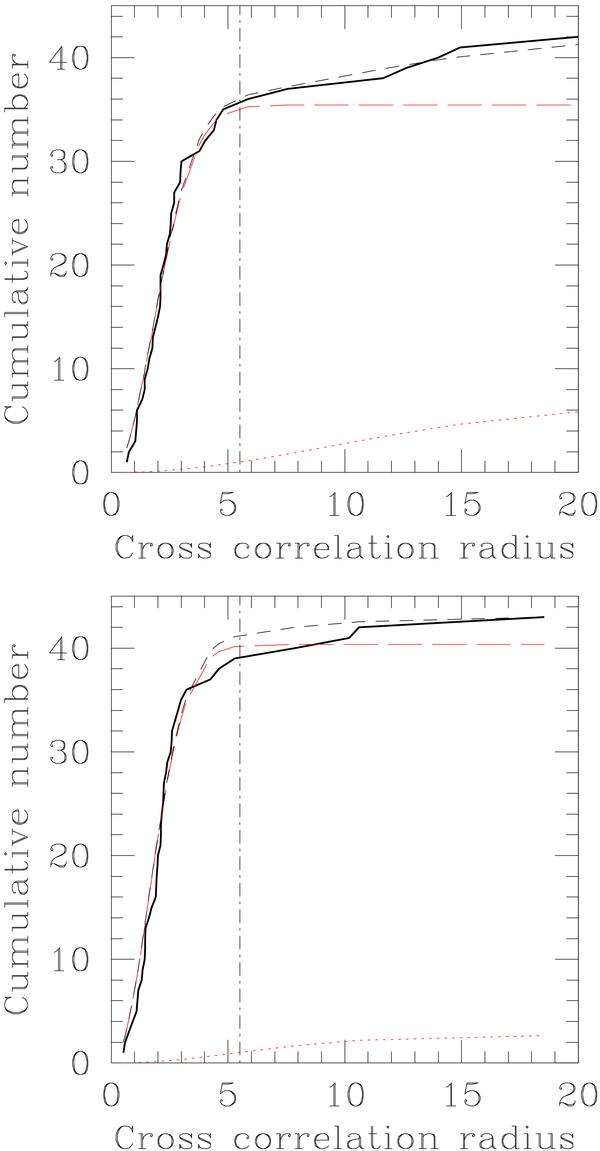
Cumulative numbers of correlations between the X-ray detections and the GSC2.2 catalogue (upper panel) or the 2MASS catalogue (lower panel). The thick curves represent the observed numbers, the short dashed curves show the best fits and the dotted and long dashed curves correspond to the spurious and real number of correlations respectively. The vertical dot-dashed line identifies the optimal correlation radius at  .
.
Current usage metrics show cumulative count of Article Views (full-text article views including HTML views, PDF and ePub downloads, according to the available data) and Abstracts Views on Vision4Press platform.
Data correspond to usage on the plateform after 2015. The current usage metrics is available 48-96 hours after online publication and is updated daily on week days.
Initial download of the metrics may take a while.