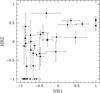
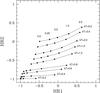
Fig. 4
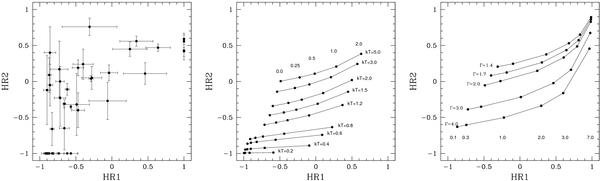
Left panel: hardness-ratio diagram: HR2 versus HR1 for all the observed objects which have both values defined. The error bars represent one standard deviation. The four sources with HR1 = 1 are from top to bottom #34, #33, #13 and #25. The four other hard sources are, in order of decreasing HR1, #8, #5, #1 and #16. Middle panel: computed positions in the same hardness-ratio diagram of synthetic on-axis sources (optically thin thermal plasma emission mekal models): solid lines represent the position of mekal models as a function of the absorbing column density (NH = 0., 0.25, 0.5, 1.0 and 2.0 × 1022 cm-2, from left to right), for several values of the temperature (kT = 0.2, 0.4, 0.6, 0.8, 1.2, 1.5, 2.0, 3.0 and 5.0 keV, from bottom to top). Right panel: idem but for powerlaw models (NH = 0.1, 0.3, 1.0, 2.0, 3.0 and 7.0 × 1022 cm-2, from left to right), for several values of the photon index (Γ = 1.4, 1.7, 2.0, 3.0 and 4.0, from top to bottom).
Current usage metrics show cumulative count of Article Views (full-text article views including HTML views, PDF and ePub downloads, according to the available data) and Abstracts Views on Vision4Press platform.
Data correspond to usage on the plateform after 2015. The current usage metrics is available 48-96 hours after online publication and is updated daily on week days.
Initial download of the metrics may take a while.