Fig. 1
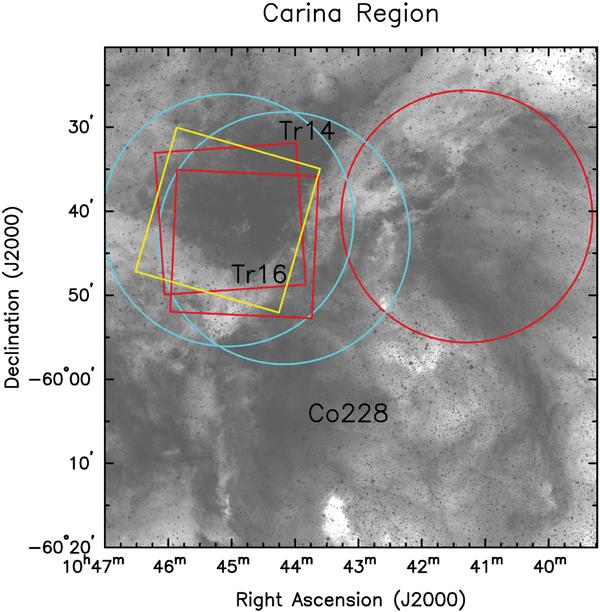
Sketch of the Carina region with the positions of the various X-ray surveys. The regions are superposed to an R filter image where the open clusters Tr 14 and Tr 16 are located. Starting from Tr 16, note the well-known V-shaped dark lane (appearing white). The field investigated here is on the right side, indicated by a circle (red in the electronic version of the paper, dark-grey in the printed version). The other two circles (light-blue, looking light-grey) represent the survey reported by Antokhin et al. (2008). Both surveys are based on XMM-Newton observations. The two squares (red/dark-grey) represent the Chandra pointings analysed by Evans et al. (2003, 2004) and Albacete-Colombo et al. (2008). The latter corresponds to the less tilted square. The third square (yellow/white) stands for the Suzaku investigation (Ezoe et al. 2009).
Current usage metrics show cumulative count of Article Views (full-text article views including HTML views, PDF and ePub downloads, according to the available data) and Abstracts Views on Vision4Press platform.
Data correspond to usage on the plateform after 2015. The current usage metrics is available 48-96 hours after online publication and is updated daily on week days.
Initial download of the metrics may take a while.