Fig. 5
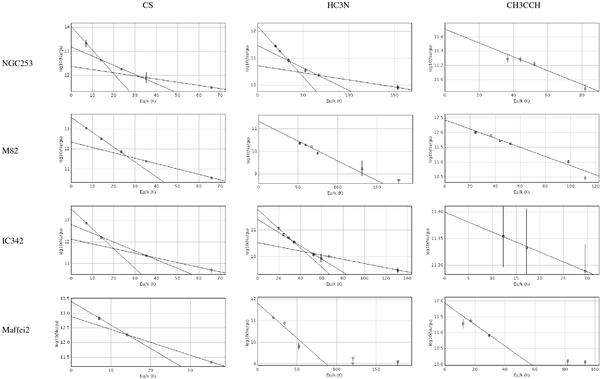
Boltzmann plots obtained with MASSA for all galaxies and molecules. The column densities and rotational temperatures of each component were obtained from the linear fits. The errors correspond to those of the integrated intensities of the Gaussian profiles. The errors in the CS diagrams of NGC 253 and Maffei 2 also take into account the uncertainty owing to the different observed positions used for each line, as detailed in Sect. 3.1.
Current usage metrics show cumulative count of Article Views (full-text article views including HTML views, PDF and ePub downloads, according to the available data) and Abstracts Views on Vision4Press platform.
Data correspond to usage on the plateform after 2015. The current usage metrics is available 48-96 hours after online publication and is updated daily on week days.
Initial download of the metrics may take a while.