Free Access
Fig. 6
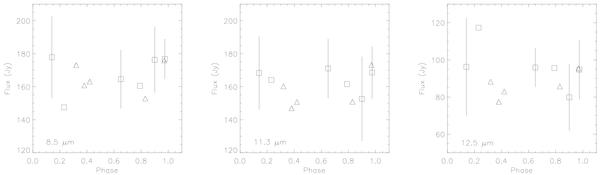
MIDI (squares) and ISO/SWS (triangles) flux of R Scl as a function of the visual phase in the 8.5 (left), 11.3 (middle), and 12.5 μm (right) spectral band corresponding to the pseudo-continuum, the SiC feature, and the C2H2+HCN feature, respectively.
Current usage metrics show cumulative count of Article Views (full-text article views including HTML views, PDF and ePub downloads, according to the available data) and Abstracts Views on Vision4Press platform.
Data correspond to usage on the plateform after 2015. The current usage metrics is available 48-96 hours after online publication and is updated daily on week days.
Initial download of the metrics may take a while.