Fig. 4
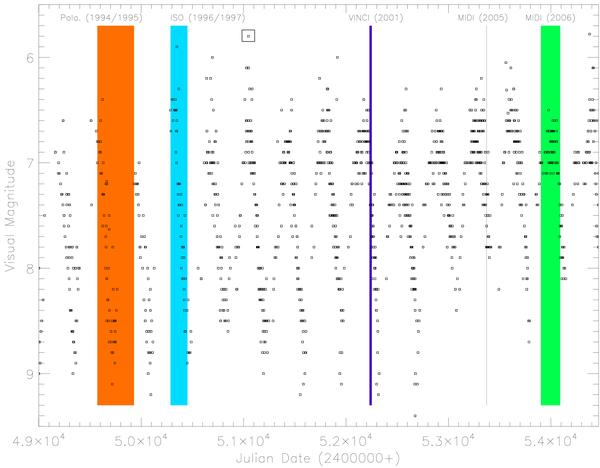
AAVSO visual lightcurve of R Scl (Henden 2009). Colored zones indicate the observing period of Polarimetric measurements (orange) (Yudin & Evans 2002), ISO/SWS measurements (blue) (Sloan et al. 2003), VINCI measurements (violet), MIDI UT measurement (black), and MIDI AT measurements (green). The point surrounded by the open rectangle represents the chosen phase-zero point (φ0 = 0).
Current usage metrics show cumulative count of Article Views (full-text article views including HTML views, PDF and ePub downloads, according to the available data) and Abstracts Views on Vision4Press platform.
Data correspond to usage on the plateform after 2015. The current usage metrics is available 48-96 hours after online publication and is updated daily on week days.
Initial download of the metrics may take a while.