Fig. 16
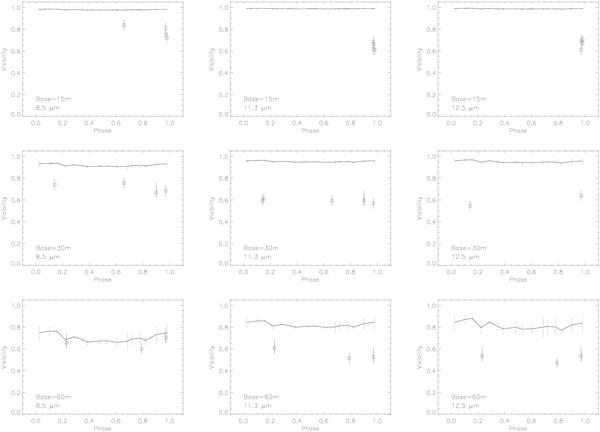
Time-dependent cycle-to-cycle averaged visibilities of the best dynamic model (solid line) superimposed on the [14−16 m], [29−31 m], and [59−62 m] baselines MIDI data (squares) in the 8.5 (left), 11.3 (middle), and 12.5 μm (right) spectral bands. Dotted error bars give the dispersion created by the cycle-to-cycle variation.
Current usage metrics show cumulative count of Article Views (full-text article views including HTML views, PDF and ePub downloads, according to the available data) and Abstracts Views on Vision4Press platform.
Data correspond to usage on the plateform after 2015. The current usage metrics is available 48-96 hours after online publication and is updated daily on week days.
Initial download of the metrics may take a while.